It’s been my experience that many small to medium-sized churches know very little about the giving base in their church beyond total giving and related trends.
There’s so much more Pastors and Finance Teams need to know in order to gauge discipleship and to develop generosity strategies based upon comprehensive data.
In my post here, I outlined 7 things Pastors SHOULD know about giving in their church – BUT there’s an 8th thing they need in order to have a comprehensive understanding of giving – A Profile of Church Giving. From this, they can understand the giving levels and begin to develop strategies to minister to people that result in growing generosity levels in their church.
Take a look at the chart below, followed by a few comments.
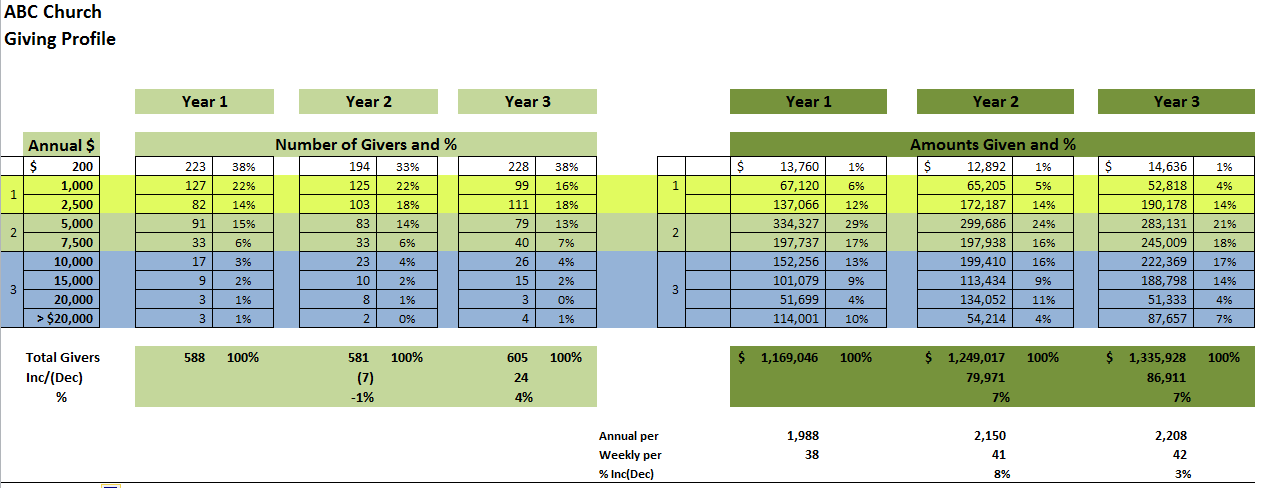
This profile provides you with a snapshot of your entire giving base across three primary giving bands. The left half shows the number of givers with the right half showing the amounts.
Let me give you a brief word or two about each giving band.
Giving Band 1 represents Developing Givers. This group tends to be the largest, but gives the least. If you include the $200 and below level in Band 1, granted, this level include gifts from children and one time guests, but by and large represent those who give sporadically and/or typically give relatively small amounts. This is the group that would benefit the most from a personal financial ministry.
Giving Band 2 is what I call the Core Giving Group. This group tends to be the 2nd largest. Their giving tends to be more consistent and they represent a significant percentage of dollars given.
Giving Band 3 is the Financial Leaders Group. It is the smallest group in terms of the number of givers but they give the most per person. They also represent a significant percentage of dollars given.
Getting back to the sample profile, looking at the most recent year (3), let’s glean a few things:
1. 72% of all givers only represent 19% of total dollars. A whopping 38% of all givers gave $16 or less per month
2. The Core Group represents 20% of givers and 40% of dollars
3. The Financial Leaders represent only 7% of givers but account for 41% of dollars
4. 46% of all givers account for 95% of all dollars, 54% account for only 5% of dollars
Note also in year 2, giving increased $80k, but givers went down by 7. However, looking under the hood: (info contained in a detailed analysis not shown)
1. 198 givers were lost or $76k, a churn rate of 34%
2. 191 new givers were added or $146k, an add rate of 32%
Excluding the 1st giving level of $200 or less: (to get a more accurate picture of recurring givers)
1. 56 givers were lost or $69k, a churn rate of 15%
2. 71 new givers were added for an increase of $139K. That’s great, but it hid the fact that 56 people stopped giving to the tune of $69k. Pastor probably had no idea. Had he known earlier, and ministered earlier, the losses may have been adverted.
Had it not been for the new givers added, total giving would have declined.
If this church could reduce the churn rate to 10%, it could return $46k to the Ministry PER YEAR. What Pastor can’t get excited about that?
Of course, the real payoff is engaging your people to help them grow on their spiritual journey. You can know who is in each band. You can know who was lost, who was added, who significantly increased or decreased their giving. Use the data that is underneath the profile to pastor, lead, pray, and minister.
If you need a Giving Profile Analysis for your church, I can help. You’ll get the above and a lot more. See this for more info.
Comments are closed, but trackbacks and pingbacks are open.