Another report Pastors, Finance Teams and Staff need on Mondays is a report that keeps them abreast of giving and available funds for ministry.
I issued such a report that enabled:
#1 Everyone to know where we stood relative to budget, goals, and prior year for offerings, cash, givers and amounts per giver
#2 The Staff to know balances of the funds for which they were responsible
#3 Our Staff to respond sooner in their spending budgets in the event of giving declines/shortfalls [wrote about giving short-falls here]
Following is an actual report I developed/used. I hope you find it helpful. But first…
Some Background:
This report was as of 44 weeks into our fiscal 2015.
When the budget was built for fiscal 2015, we were without a Sr Pastor and thus we were a bit conservative. Our new Pastor came on board towards the end of the budget process. As you’ll see, the Lord really blessed way beyond what we were thinking at the time.
You’ll see lots of funds on this report. Our goal was to have 2 primary/promoted funds for people to give to – Budget and Building. The vast majority of giving (91%) were to these two funds. As a backdrop, in the prior year, we had 27 different fund accounts on the books and by this time had narrowed them down to 13. See this post to see how.
3 of the 13 funds were reserve funds that we had designated internally and were extensions of the Budget or Building Fund. [wrote about reserves here]
Of the other funds, 1 was a Trust Fund that was established a very long time ago. The remaining 9 funds were a result of designations or from ticketed events. These ticketed events were not funded by the budget, but 100% thru ticket sales. Our biggest annual event was our annual Wild Game Dinner (WGD) where we would feed and present the Gospel to 3000+ men.
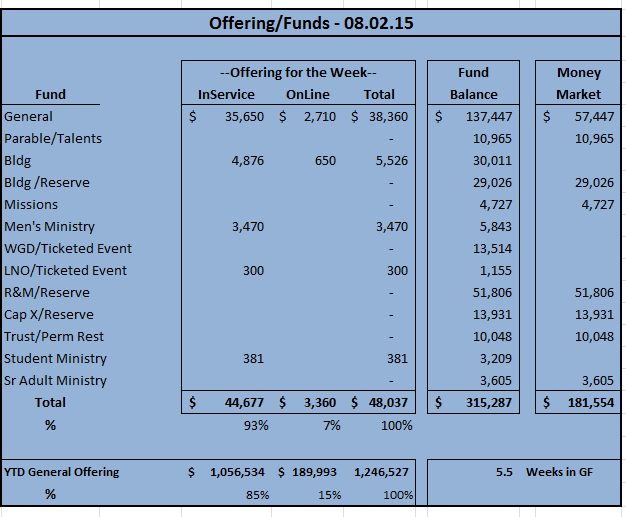
Here’s the top part of the weekly report:
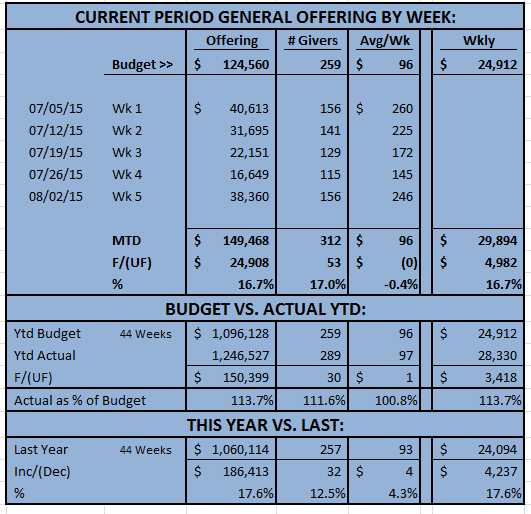
Here’s the bottom half of the weekly report:
5 Sections:
1. Offerings/Receipts for the week by Fund along with YTD General Budget Offerings.
2. Cash Balances by Fund for the week, along with which Funds/Amounts were in a Money Market account.
3. Weekly Offerings and other Giver Metrics compared to budget for the month
4. Budget to Actual Section for the same info on a YTD basis
5. Current year giving vs prior year
Just the Facts:
1. We had $315k in the bank.
2. We had 5.5 weeks of Budget Funding in the General Fund. Our goal was 4.
3. We ended the month $25k over budgeted giving – driven by 53 more givers than budget.
4. On a YTD basis, regular giving was $150k over budget – driven mostly by 30 more givers than budget.
5. Regular Giving was $186k or 17% higher from the prior year to date – again driven by 12% more givers and 4% higher giving per.
In Closing:
Honestly, relative to budget, we were in a good position. We had plans in place for excess funds over 4 weeks of budget requirements, and had just executed our Upside Giving Plan for those excess funds during July. [wrote about planning for upsides in giving here]
As you can see, by the end of July, we already had more excess funds. If it was still that way by the end of September, we could execute our Upside Giving Plan again in early October.
At this stage of the year, we were keeping tabs on the number of givers and amounts per giver to validate (or not) what we were about to implement in next year’s budget.
We kept an eye on designated funds to make sure they didn’t go unused and were used for the purpose given.
Of course, we watched reserve balances to a) make sure they were adequate and b) trigger no more funding of these reserves once they reach predetermined caps.
What have you seen?